
See what we do
Below is a real study, the way we actually run one — the problem, the model, the results, the fix. Then tell us about yours.
A 200 MW data center
meets the grid
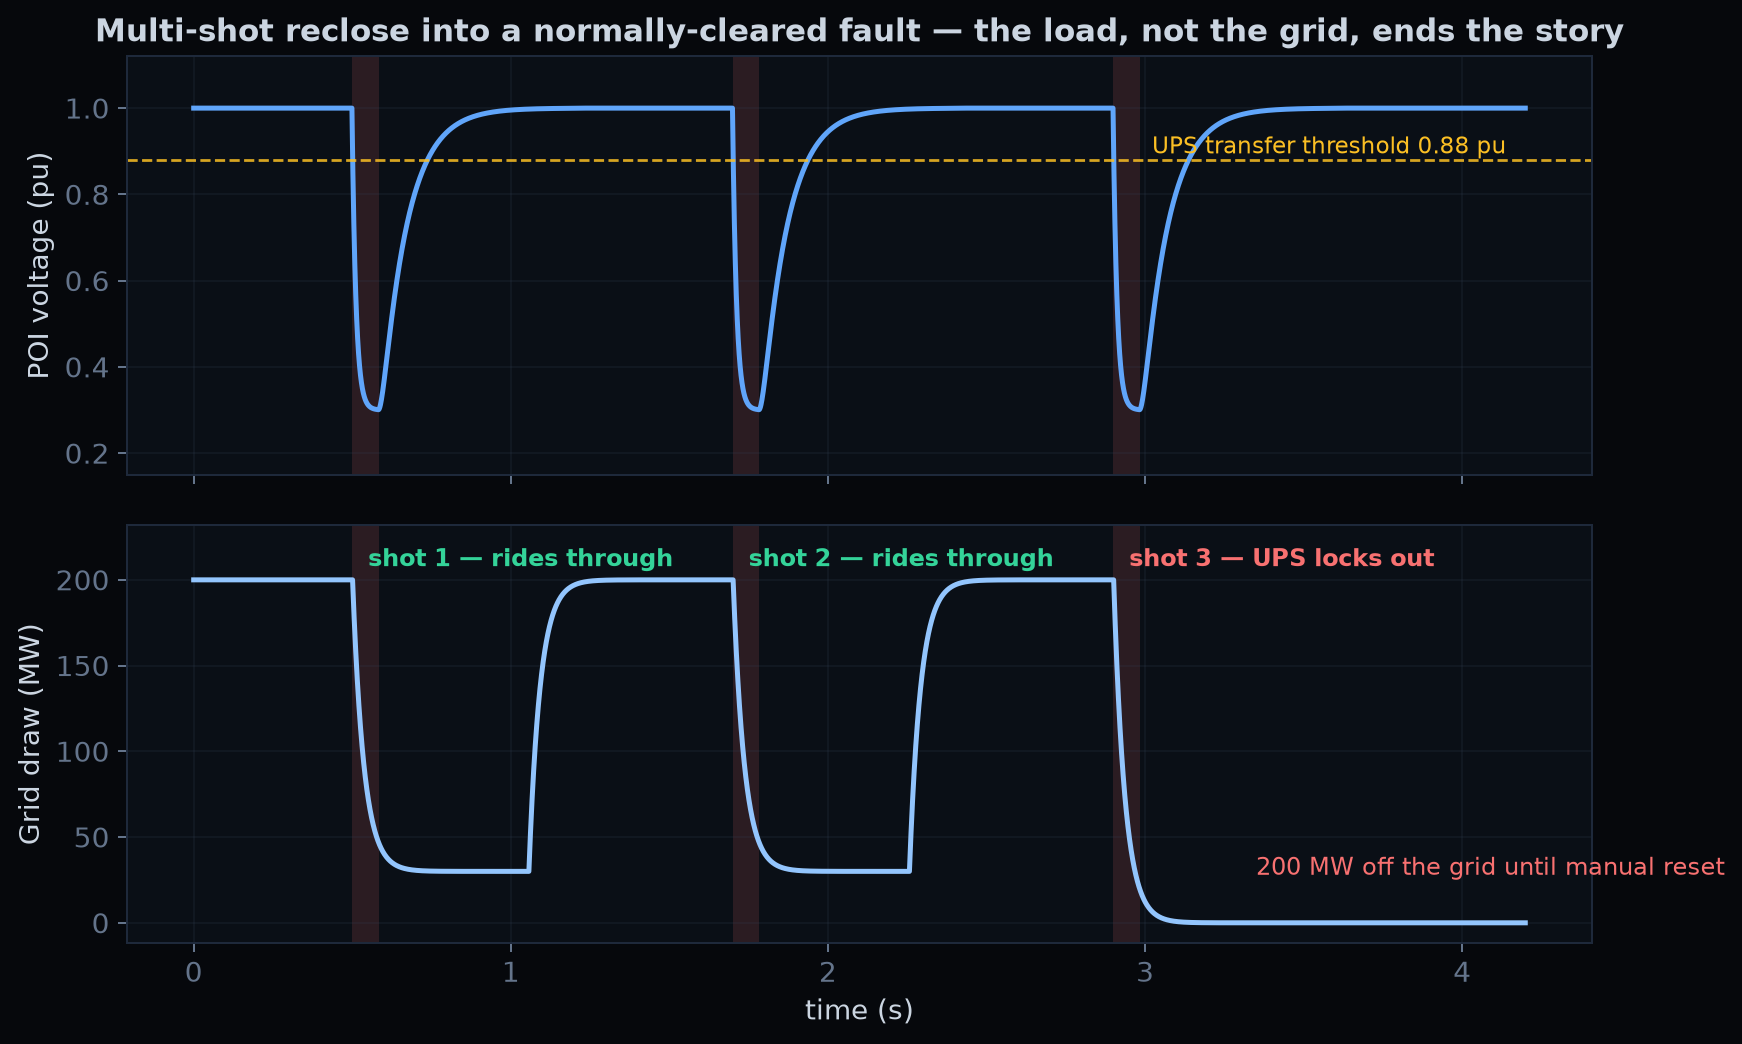
In July 2024, roughly 1,500 megawatts of data-center load dropped off the Eastern Interconnection at once. A larger event followed in early 2025. Regulators investigated, and the finding surprised people: the grid did its job. A routine sequence of faults cleared normally. The data centers tripped themselves — their UPS systems transferred to backup on each voltage sag, and count-based logic locked the facilities off the grid until someone manually reset them.
Our example study reproduces that failure mode end to end for a 200 MW hyperscale facility interconnecting at 230 kV, sweeps the conditions that matter, and then demonstrates the fix — which turns out to be a settings change, not new iron.
How we run a study
Every assumption in one place
One configuration file holds every modeling choice — load, grid strength, transformer, thresholds, sweep ranges. Change it, re-run, everything updates.
The model is code
We build the simulation model programmatically — every component placed and wired in reviewable code, not clicked together in a GUI. Reproducible by anyone, defensible line by line.
Sweep what matters
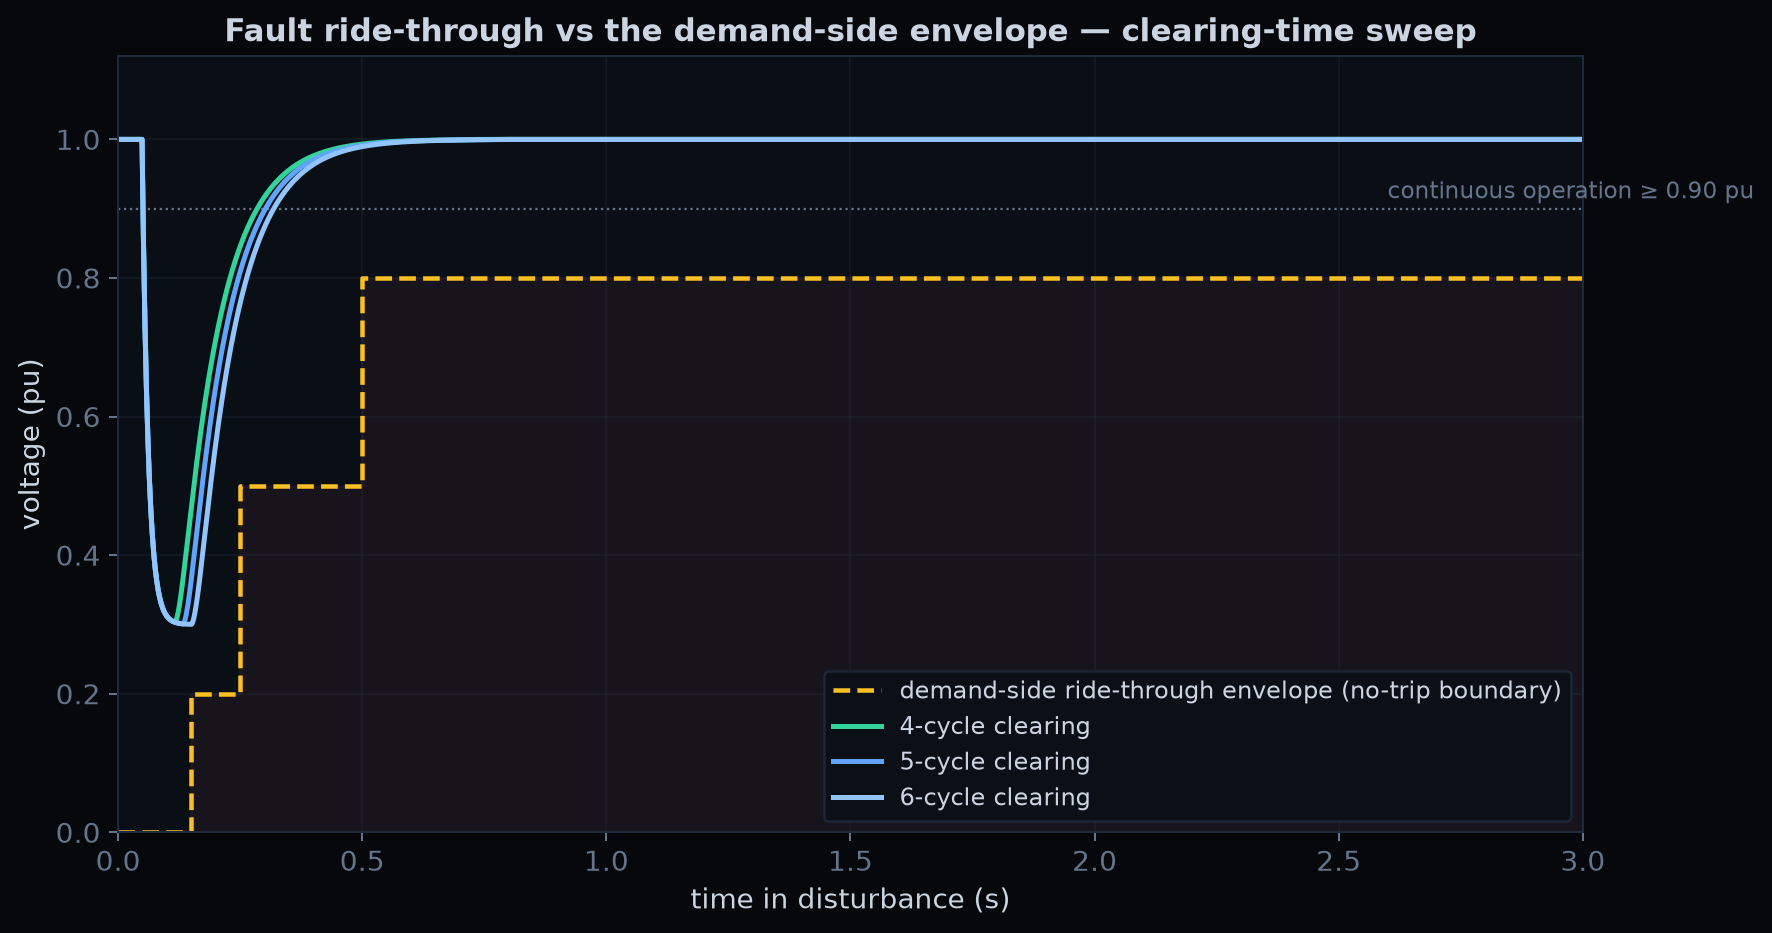
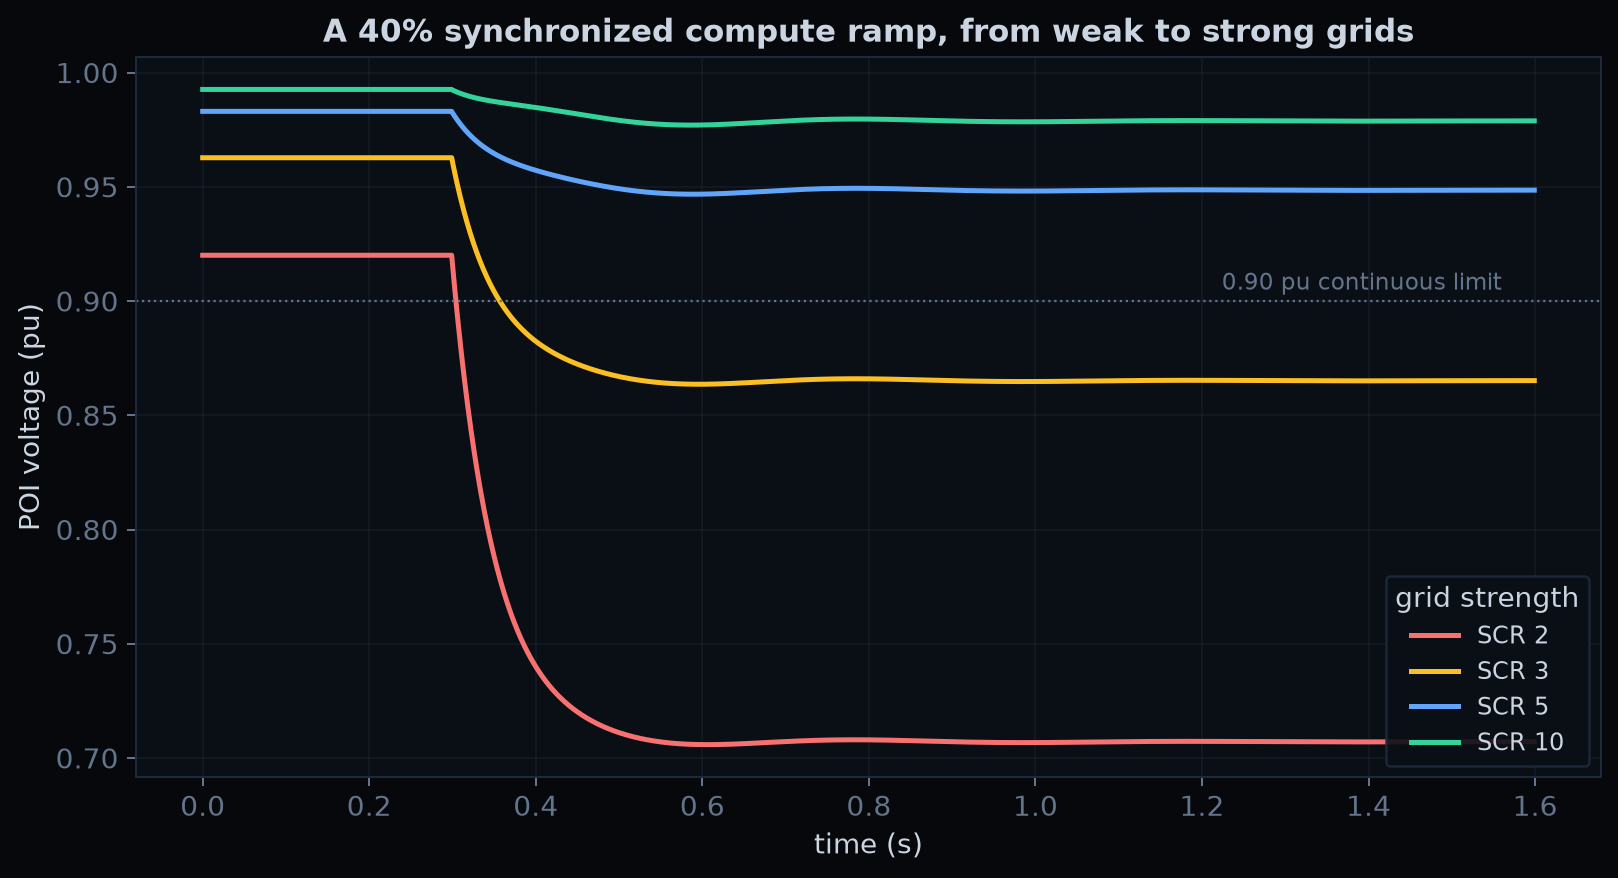
Fault type, clearing time, reclose sequences, grid strength, load steps — the answer is a map of where you are safe and where you are not, never a single point.
We attack our own results
Independent hand calculations and an adversarial self-audit go after every claim before you see it. What survives is what we stand behind — and what a PE stamps.
The results that tell the story
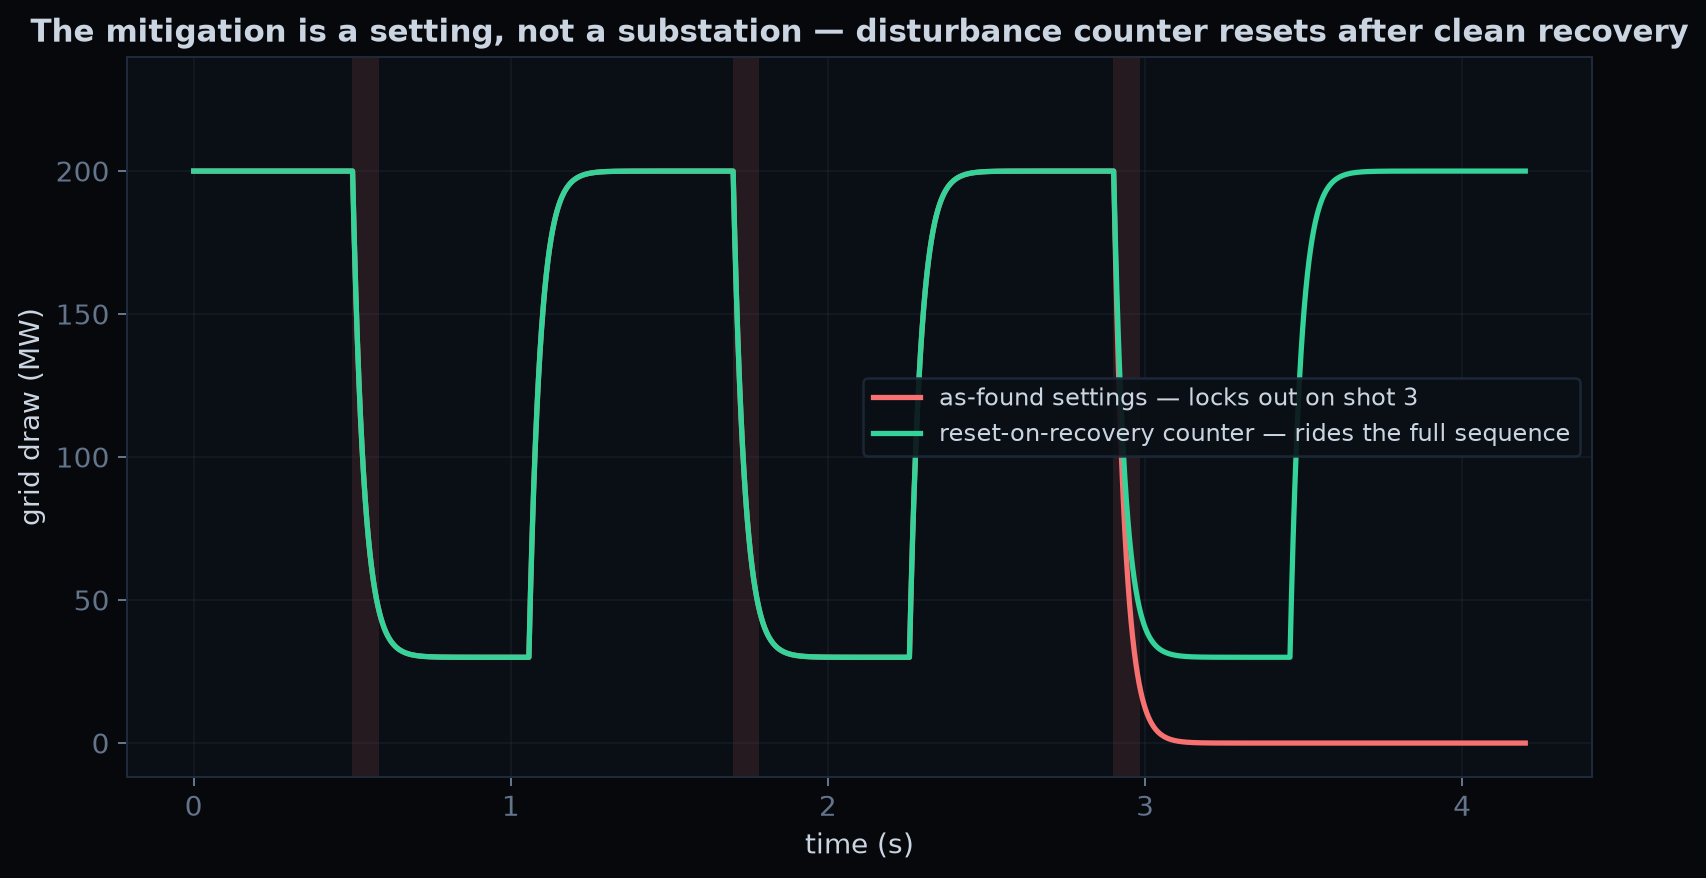
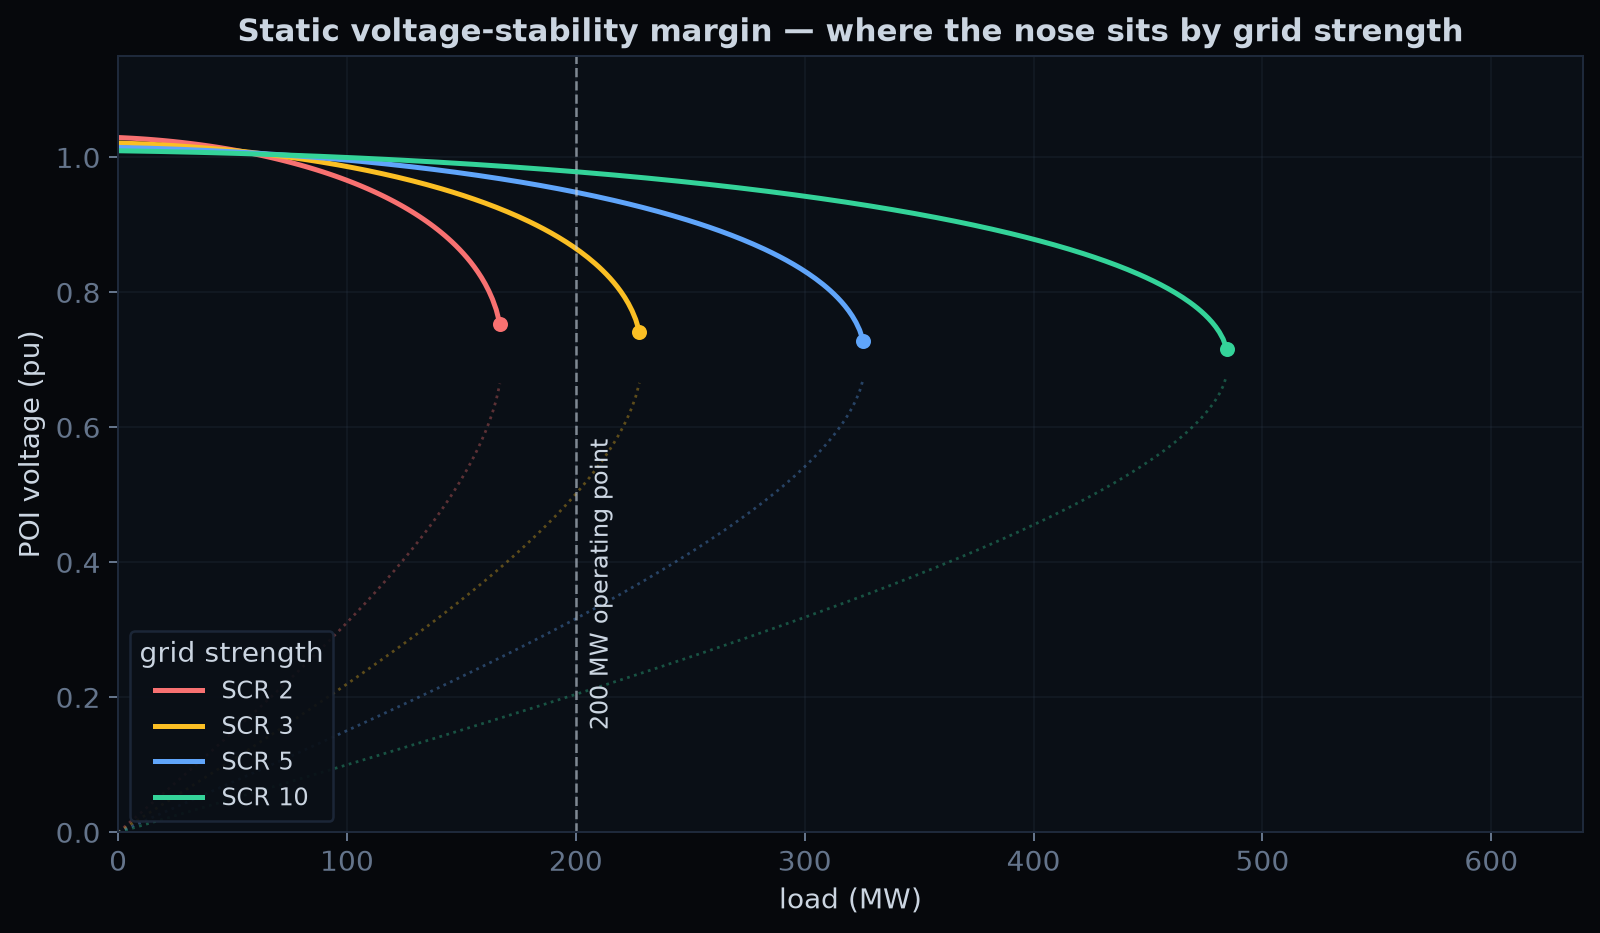
Representative waveforms, re-simulated in our open Python pipeline from the study’s documented parameters.
The grid did its job
Every fault in the sequence cleared normally.
The load ended the story
Count-based lockout, exactly as documented in the real events.
The fix was a setting
Reset-on-recovery logic. No new equipment, no new iron.
Now, about your project
This goes straight to the whole team. We reply with an honest read — even if the honest read is that you do not need us.